It’s that time of week again Linkarati readers - time for another edition of Tutorial Tuesday, our weekly series where we walk you through a useful digital marketing tool, process, or strategy.
This week we’ll be tackling one of my greatest personal nemeses, WordPress. Specifically, we will be taking a look at the information provided within WordPress Site Stats. Because this is a fairly large topic, I will be splitting this tutorial into two parts over the next couple of weeks.

While WordPress has certainly been a source of frustration for me, due to its various quirks and general lack of intuitiveness, it still remains one of the most popular content management systems (CMS) on the web today. If your site runs on WordPress, learning to use WordPress with minimal strife is a valuable skill.
WordPress really is useful when it comes to managing a blog/site. One handy aspect of WordPress is there are a number of helpful plugins you can install to help WordPress run more efficiently. Jetpack is a very useful plugin that comes equipped with Site Stats (To install Jetpack, go here).
Now keep in mind the data in Site Stats may not always be the most accurate, and I urge you to utilize Google Analytics whenever possible as it will have the most accurate data. However, Jetpack is a great option for beginners who aren’t very familiar with Google Analytics, and it offers a good starting point. Also, the information provided within WordPress can still be valuable and give you a snapshot of your site’s performance.
Well, now that I have complained about WordPress enough, let’s get into the tutorial! Today we will walk through how to:
- Login to the WordPress Dashboard
- Examine Pageviews/Traffic
- Dig Deeper with Site Stats “Summaries”
Step One: Login to the WordPress Dashboard
Before we start examining any of the data, we need to first login to the WordPress Dashboard.
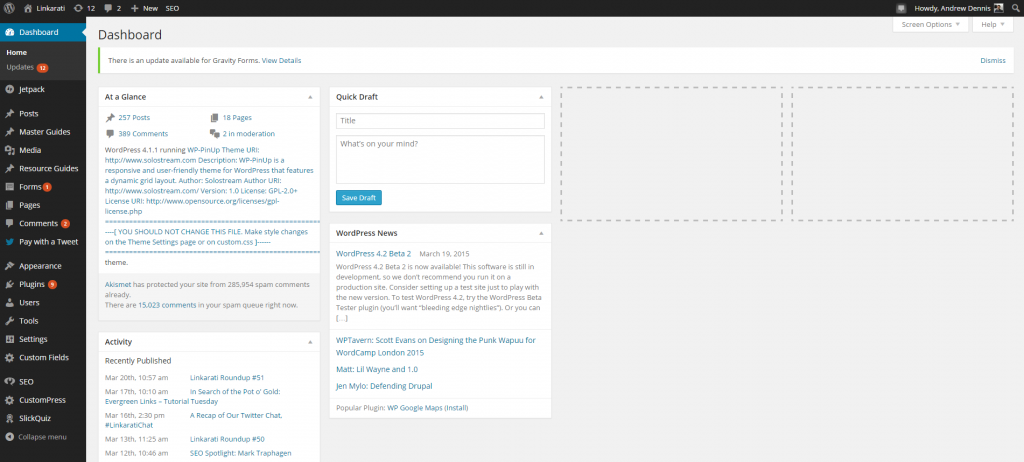
Once you have input your login credentials, you will be taken to the Dashboard. For this Tutorial we will be looking at Linkarati’s WordPress. Here is what our Dashboard page looks like:
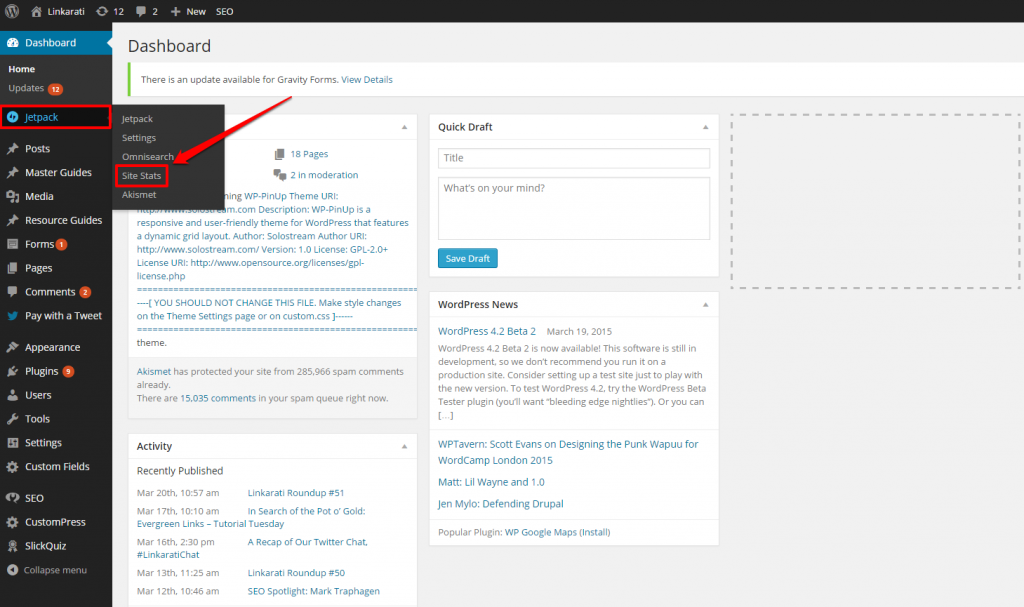
If we hover over “Jetpack” on the side-nav it will bring up a drop-down menu from which we can select “Site Stats”:
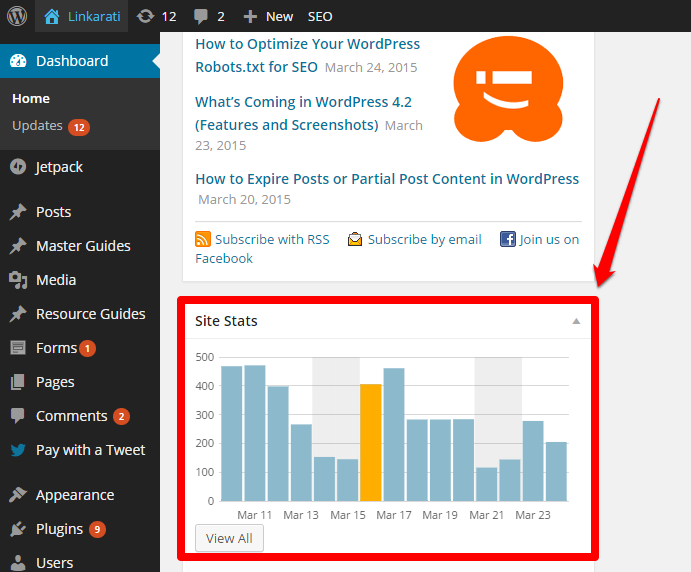
We can also simply scroll down the page to find the Site Stats section, and then click the “View All” button:
Either option will take us to the Site Stats page.
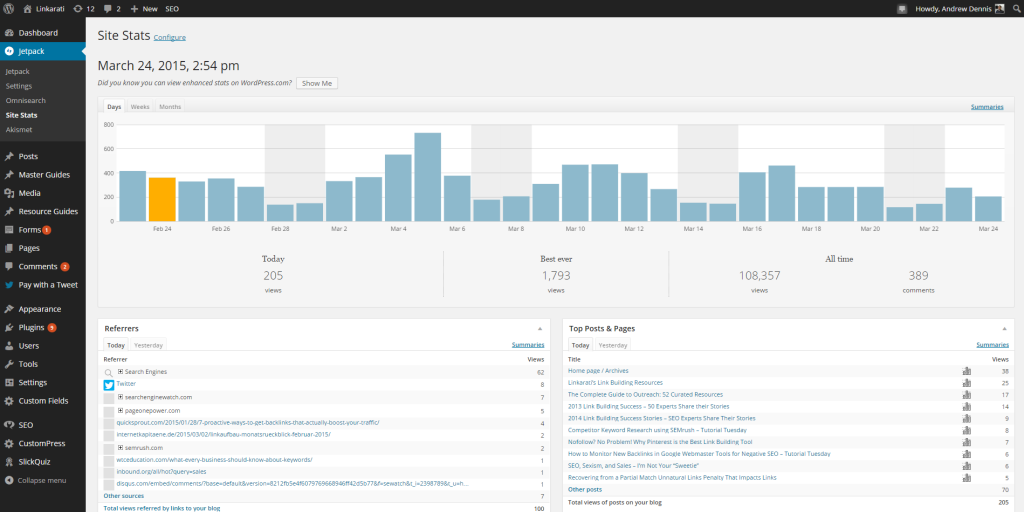
Now that we’ve made our way to the Site Stats page it’s time to dig into some of the data.
Step Two: Examine Pageviews/Traffic
This Site Stats section of WordPress offers some helpful insights into your site’s performance in regards to pageviews, which can give you a rough idea of what your traffic looks like.
Looking at the Site Stats page will quickly give us an overview of general traffic trends over the past 30 days in the form of a bar graph.

Along with the graph, we can also see pageviews for:
- Current day (Today)
- Best ever
- All time (views and comments)

The 30-day graph provides a quick visual representation of your site’s recent performance. But you can also look at graphs that will show you the broader, long-term performance of your site by switching to “Weeks”:

Or “Months”:

The “Months” graph in particular can give you an indication of whether or not your site is experiencing long-term growth.
Along with examining the overarching graph, you can also hover on a specific day/week/month to get the number of views for that particular bar.

If you are filtering by day, you can also see any posts/content you published that day:

This information can be helpful when looking back to see what content has driven traffic in the past by seeing where traffic spikes correlate with certain content being published.
Step Three: Dig Deeper With Site Stats “Summaries”
You can also drill down further by clicking on “Summaries”:

Clicking on the “Summaries” link will take you to a page that looks like this:
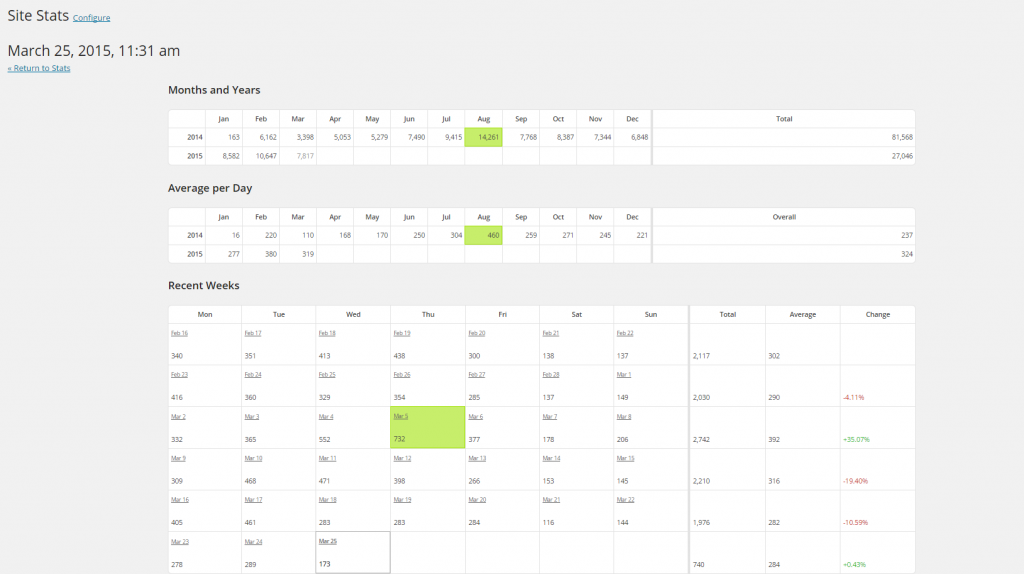
There is some great data provided on this page, broken down into three separate sections:
- Months and Years
- Average per Day
- Recent Weeks
Months and Years
Here you can see the overall number of pageviews broken down by month throughout the entire lifetime of your site:

You can also see total number of pageviews by year:

This data will also show you which month had the highest number of pageviews, which will be highlighted in green:

Average per Day
This section will give you (as you might have guessed) a breakdown of average pageviews per day for each month:

As well as daily averages for each year:

You can identify which month had the highest average of daily pageviews, again highlighted with green:

Recent Weeks
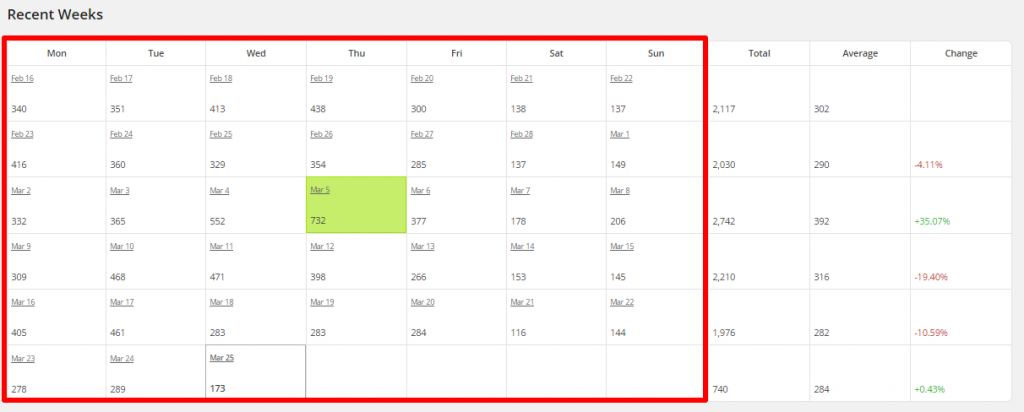
There is a bit more information to be gleaned in this final section. You can see a breakdown of daily pageviews by week:
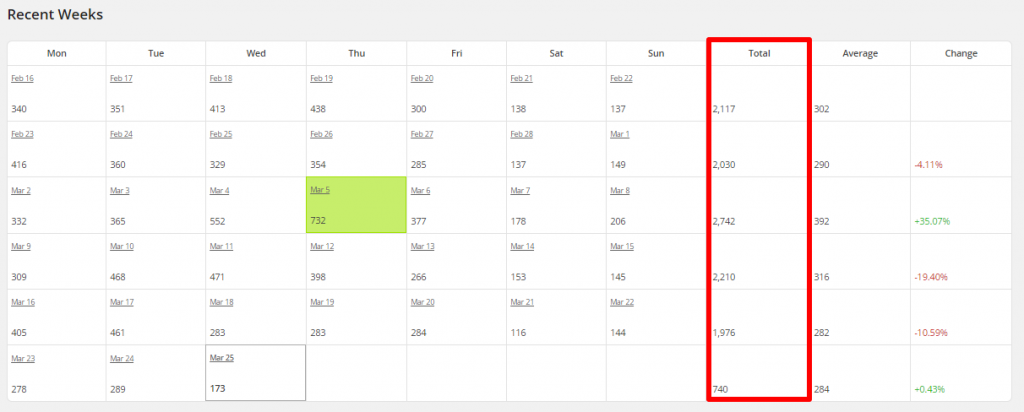
Total pageviews for each week:
Average number of pageviews by week:
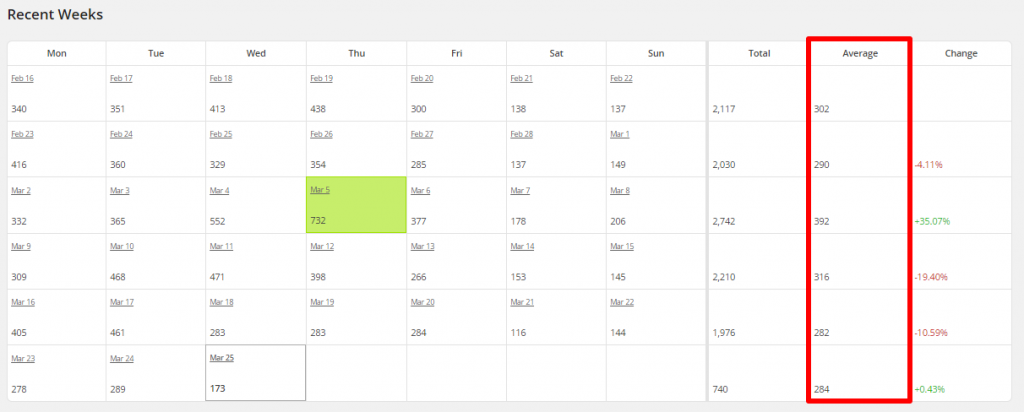
And you can even see the weekly fluxes and the %Change from week to week:
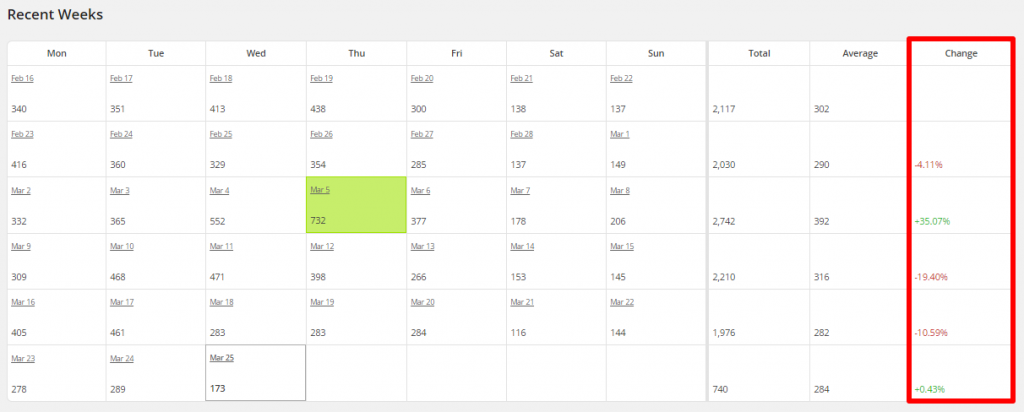
The %Change data can be particularly useful for spotting any drastic fluctuations.
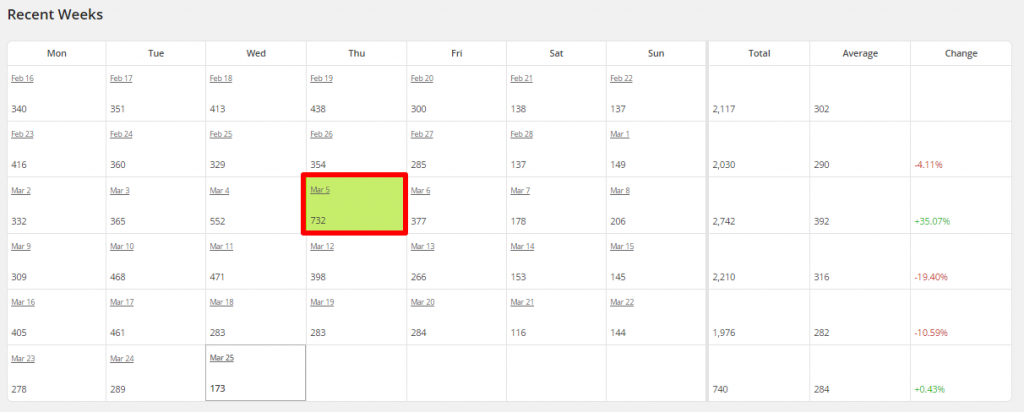
Finally, you can see which day had the highest number of pageviews in recent weeks by looking for the date highlighted in green:
Recap
Remember that WordPress isn’t always going to have the most accurate or reliable data, and you should always refer to Google Analytics. But, that doesn’t mean you can’t glean some valuable insights from the information WordPress offers. In order to view some of this data follow the steps outlined here:
- Login to the WordPress Dashboard
- Examine Pageviews/Traffic
- Dig Deeper with Site Stats “Summaries”
While we have covered a fair amount of the information contained within Site Stats, there is still more. In Part 2 of this Tutorial Tuesday we will take a look at some of the remaining aspects of Site Stats which we have not yet covered. See you next week!

