Hello everyone, and welcome to a Linkarati first, a two-part Tutorial Tuesday!

Last week, in part one of this tutorial, we explored some of the data that is provided within WordPress through the Jetpack “Site Stats” plugin. Today we will wrap up what we started in part one, and look at the rest of the information we can glean from Site Stats.
In part two we will:
- Examine Top Posts & Pages
- Deep Dive into Individual Posts/Pages
- Look at Referral Data
Alright, let’s dive back in!
Step One: Examine Top Posts & Pages
After looking at your pageviews and traffic data, it’s time to examine how your top posts and pages (your site’s content) are performing.
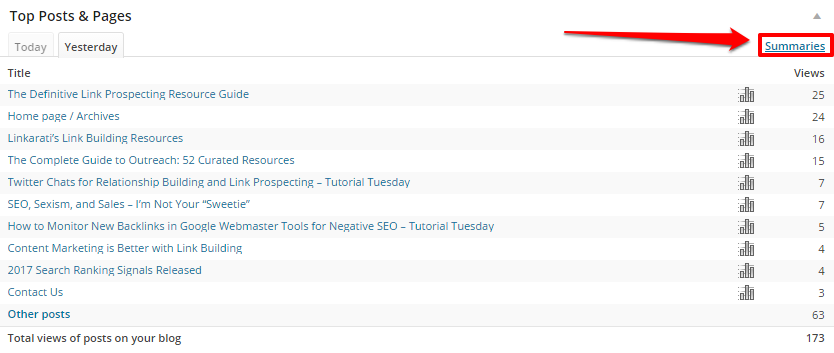
From the Site Stats dashboard, you can see “Top Posts & Pages” located in the bottom right corner:
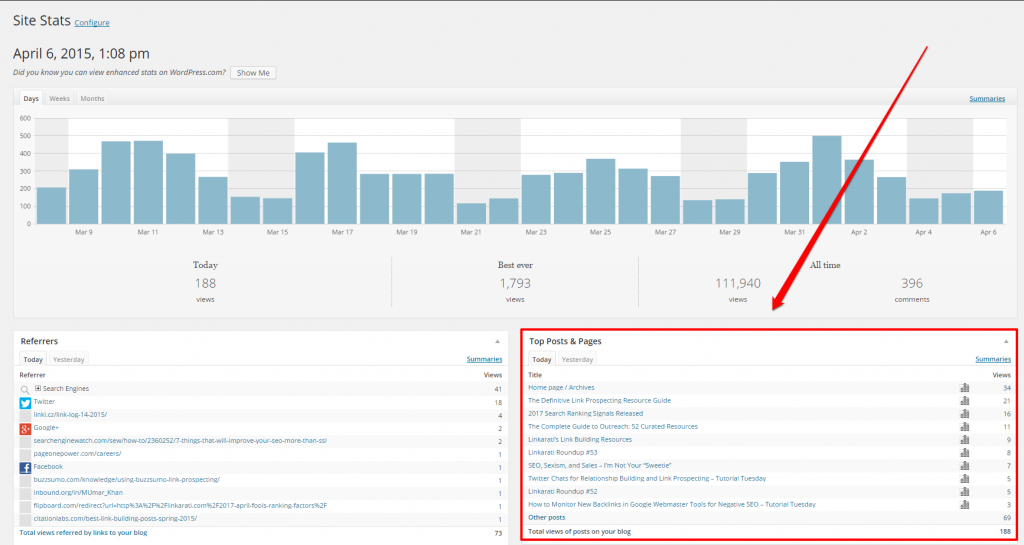
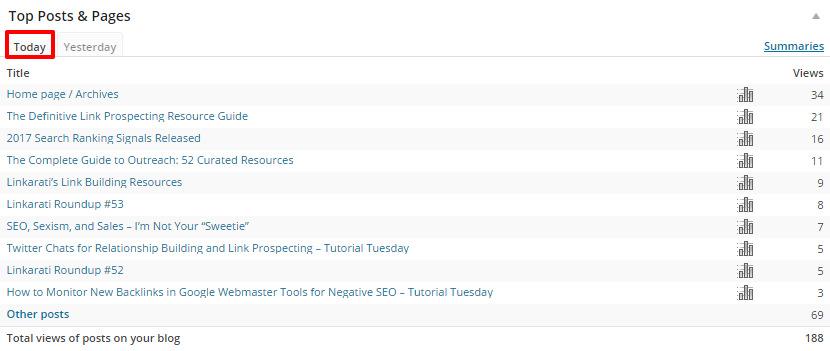
From this front page you can quickly glance at your top performing posts of the day:
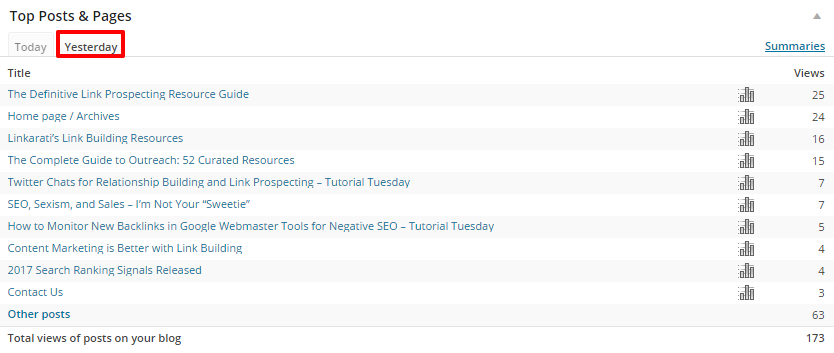
Or you can find out which posts did the best the day before:
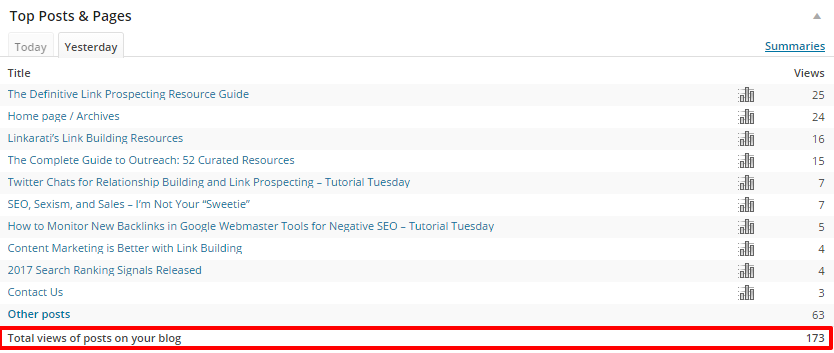
You can also get quick look at the total pageviews for your site from yesterday:
This surface level information is nice for a quick overview of the performance of your pages.
However, to really dig into the data you need to click on the “Summaries” button. Next, let’s take a deeper dive into the data provided by Site Stats.
Step Two: Deep Dive into Individual Posts/Pages
You can find the “Summaries” button here:
Clicking on the “Summaries” link will take you to a page that looks like this:
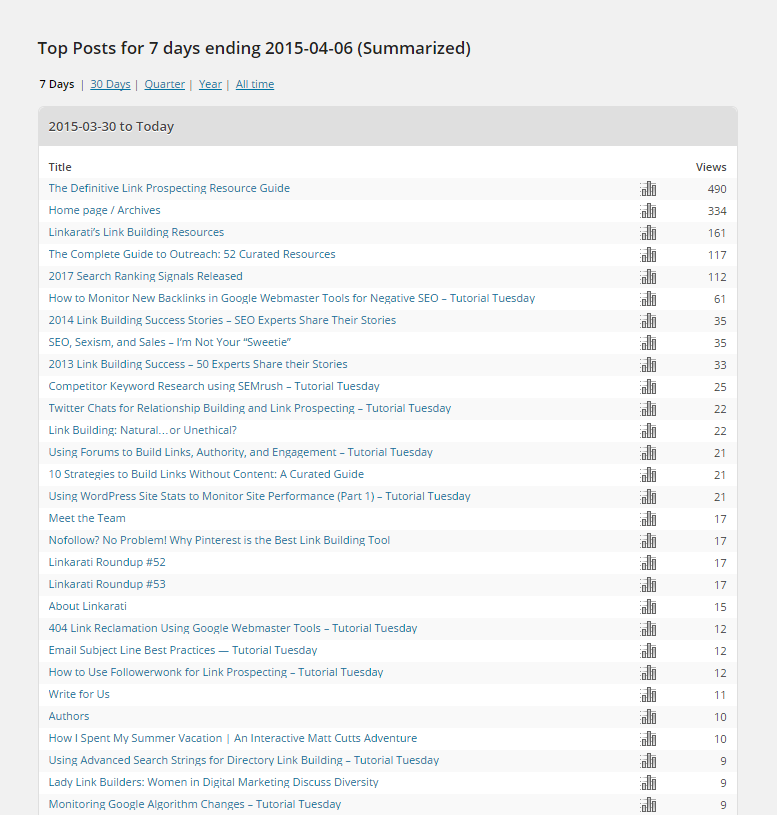
The information provided here can give you an idea of what your best performing content is over varying periods of time, including:
- The last 7 days
- The last 30 days
- The previous quarter
- The past year
- All time performance over the life of the site
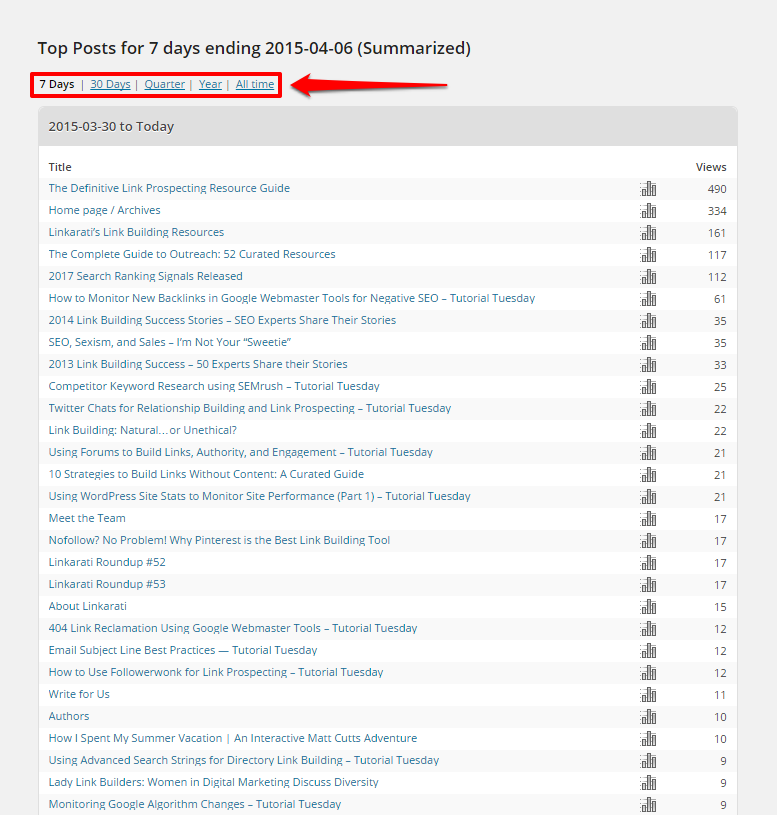
Looking at the “All time” statistics can be a nice way to identify your most popular content, but you can dig even deeper by clicking next the chart icons next to each post/page:
![]()
For this tutorial we will look at the data associated with our Link Building Resources page. Here is the page we’re taken to after clicking on the icon:
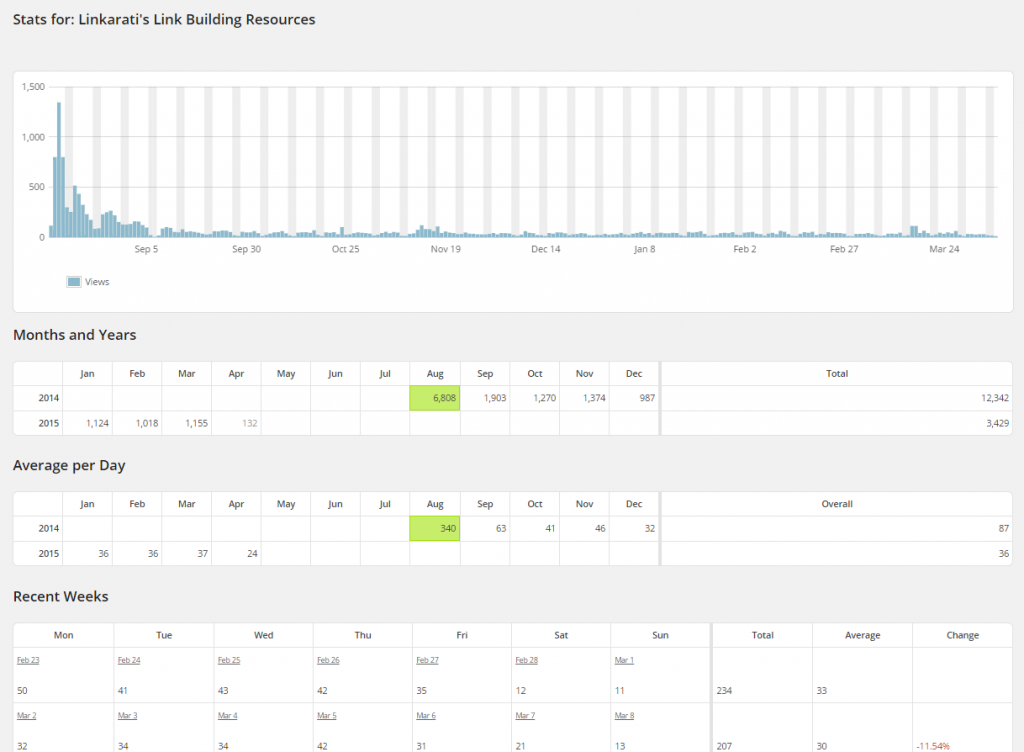
As you can see, there is a wealth of information stored here.
First, let’s look at the top graph:

This graph shows the number of pageviews our Resource page has accumulated since it went live back on August, 12th, 2014. The chart will give us a visual representation of overall performance for the page, and we can see generally how many views it averages.
Also, we can hover over a specific day to see how many pageviews the Resource page had on that particular day. Let’s look at August 14th, 2014, by far the biggest day in terms of pageviews:

While this bar graph offers some nice visual data for us, you can actually glean more insight from the other sections below.
In the other sections, the data will break down into:
- Months and Years
- Average per Day
- Recent Weeks
Let’s look at each.
Months and Years
The months and years section will give you total pageviews for each month that page has been live:

And, of course, total pageviews for each year:

You can also see which month had the highest pageviews, highlighted in green:

Average per Day
One of the more useful sections for judging the performance of an “evergreen asset” like our Link Building Resources page is the “Average per Day” section.
Here you can see if your page is continuing to attract pageviews at a steady pace. You are provided with daily averages by month:

And by year:

Again, highlighted in green will be your month with the highest daily averages:

Recent Weeks
Finally, you can drill down to pageviews on a daily level within the “Recent Weeks” section.
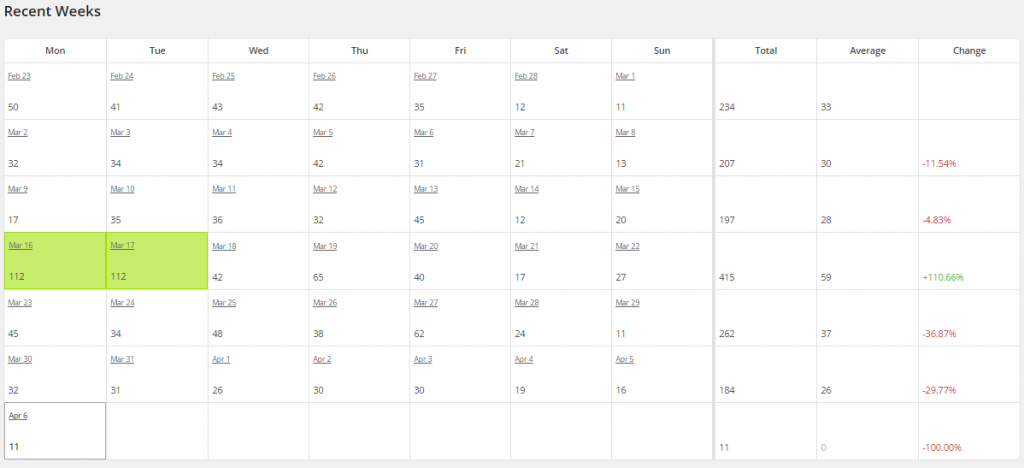
You can look at daily pageviews throughout a certain week:
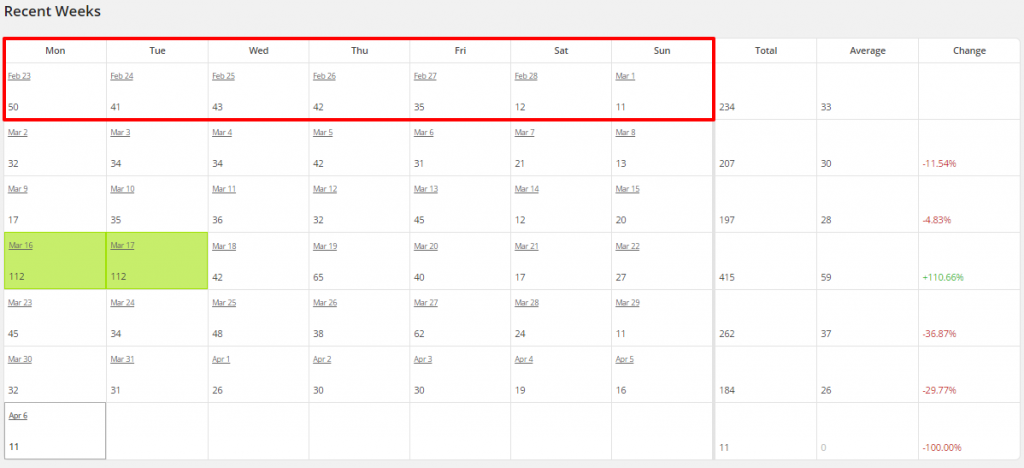
You can see weekly pageview totals:
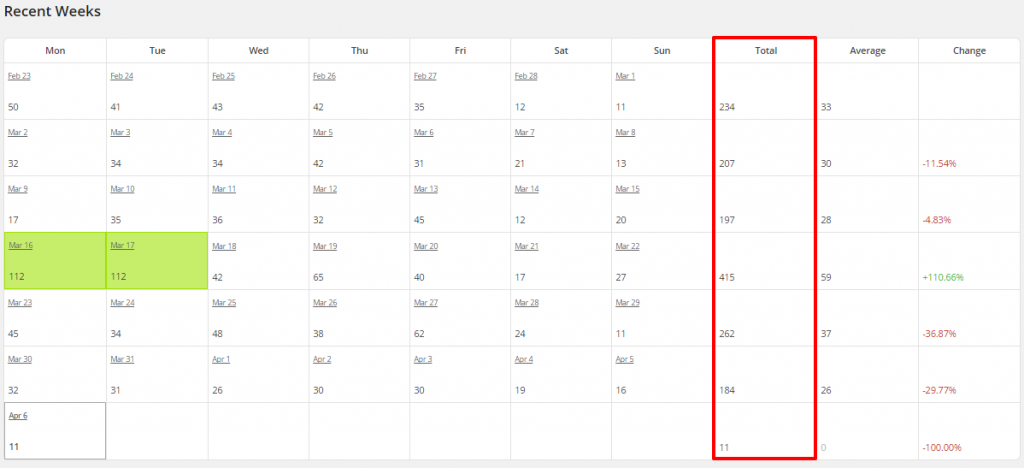
You’re also given weekly averages:
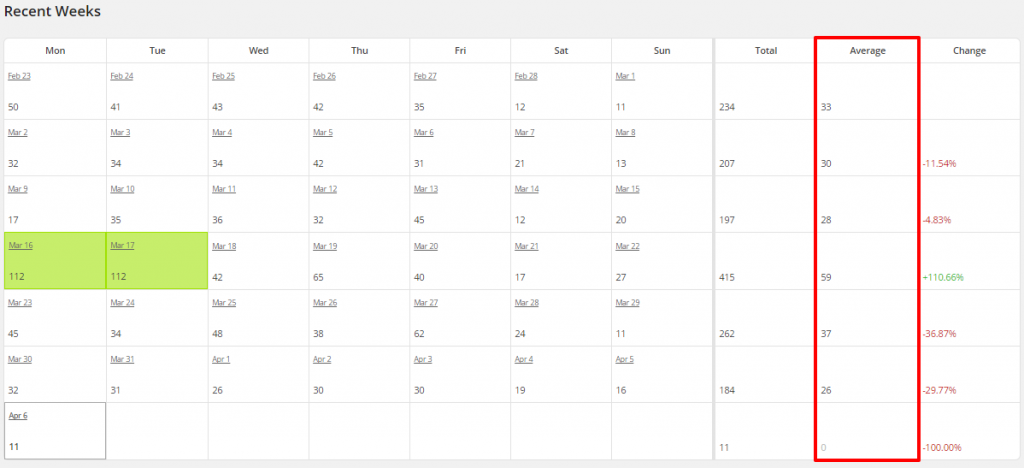
And my personal favorite, %Change from week to week:
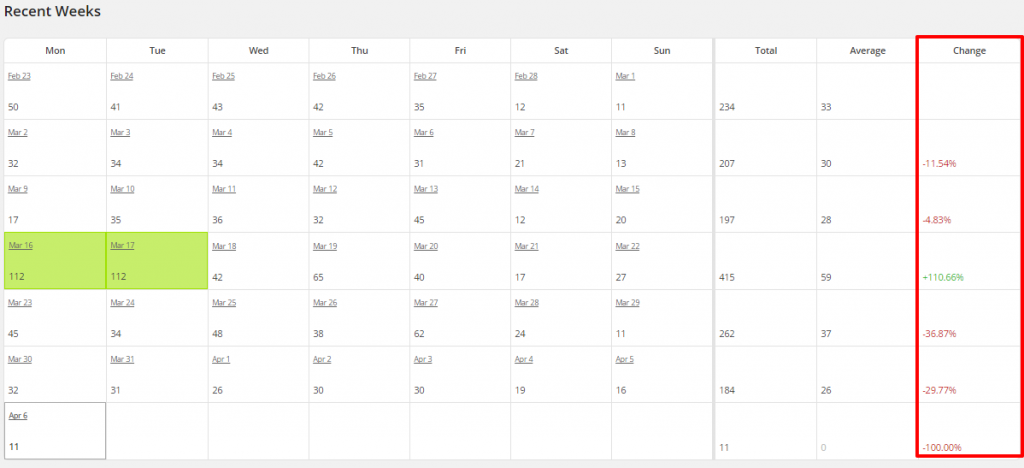
You can also see which day(s) in the past seven weeks had the highest pageviews (once again highlighted in green):
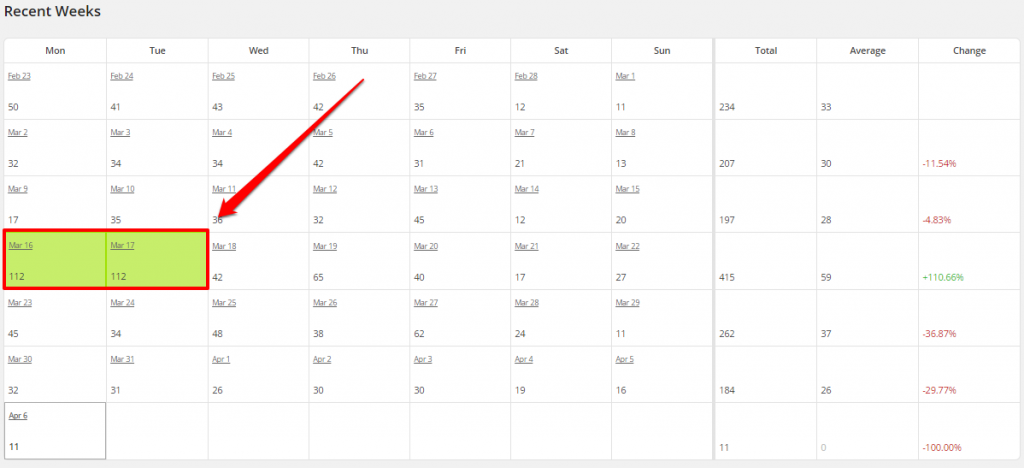
This information can be useful as you can look back and see if you did any specific promotion for that page on the corresponding day, which may have been particularly effective.
Finally, let’s examine the referral data Site Stats provides.
Step Three: Look at Referral Data
The final portion of Site Stats we will inspect is referral data which can be found on the main dashboard page under “Referrers”:
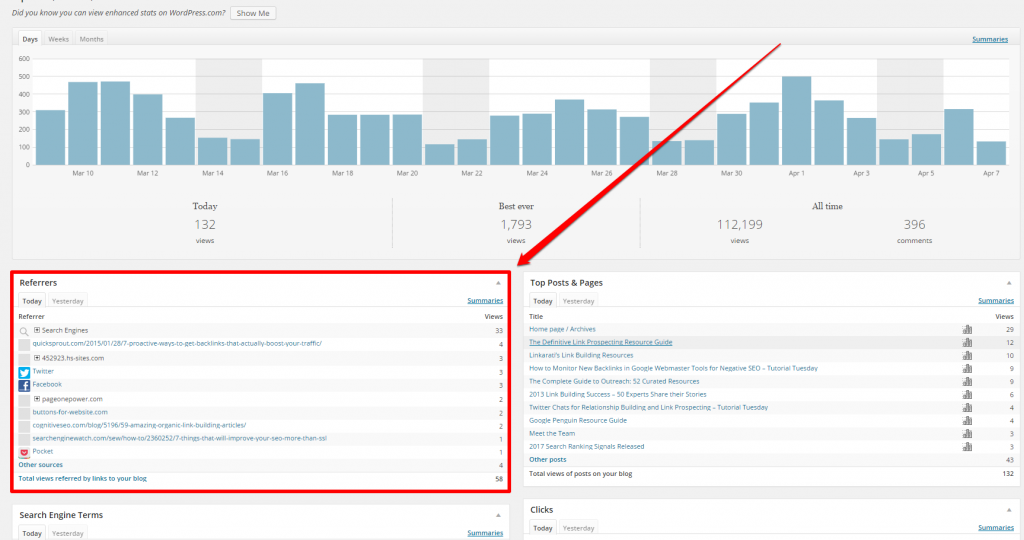
The “Referrers” section of Site Stats will tell you where your referral traffic is coming from.
As I mentioned in Part 1 of this tutorial, the data within the Site Stats plugin is never going to be as precise as Google Analytics, and this goes for referral data too. However, if you’re not very familiar or comfortable with Google Analytics, this referral information is still accurate enough to be useful.
Similar to the “Top Posts & Pages” section, “Referrers” displays referral information for the current day:
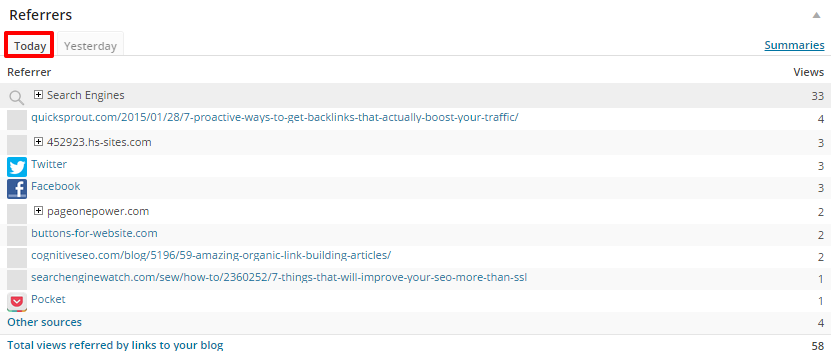
And yesterday:
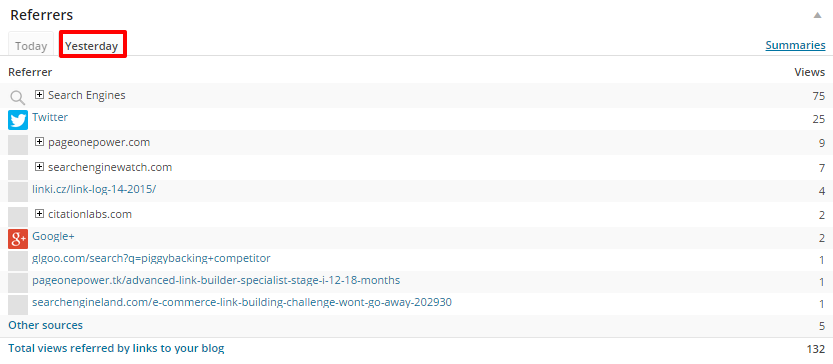
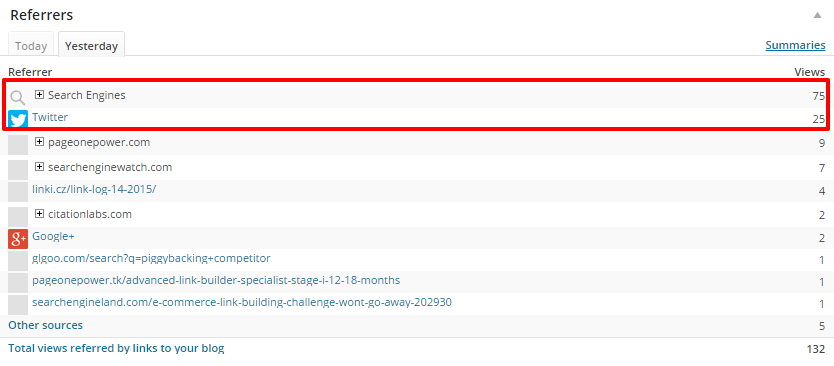
Looking at the data provided, the majority of referral traffic for Linkarati yesterday came from search engines and Twitter:
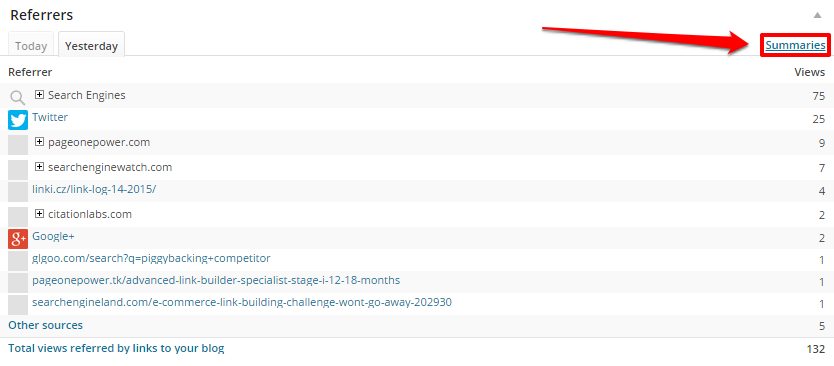
If we want to dig a bit deeper and see referral information beyond today and yesterday, we again click on the “Summaries” link:
We are then taken to a page that allows us to examine referral data for:
- The last 7 days
- The last 30 days
- The previous Quarter
- The past year
- The entire life of the site
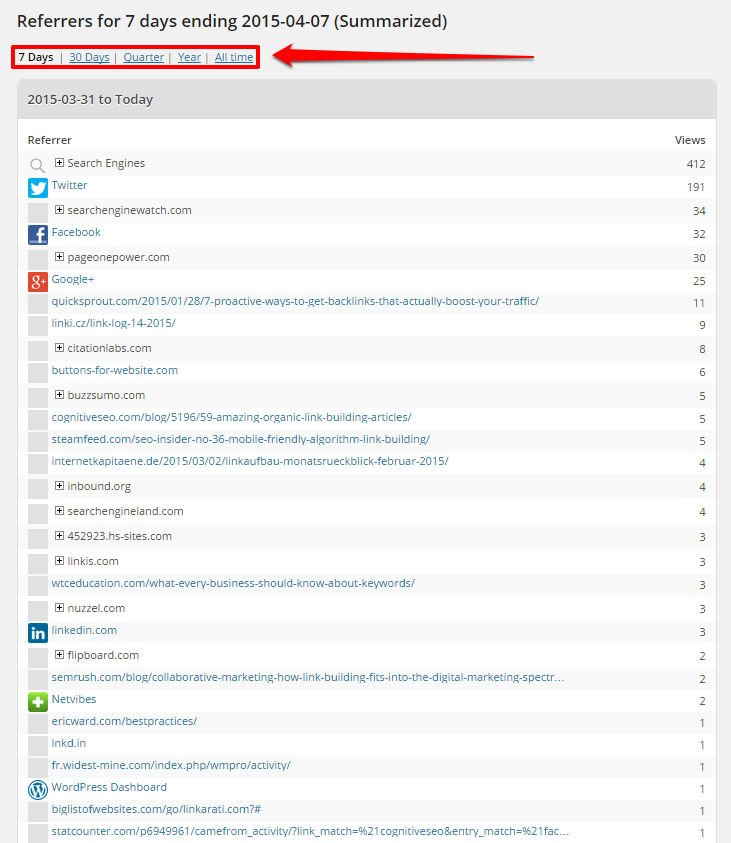
The “All time” information can be particularly helpful if you want to know where most of your referral traffic comes from.
Recap
There is a wealth of information contained within the Jetpack Site Stats plugin. While this data is not as exact or accurate as Google Analytics, it can still be very useful for those who aren’t comfortable with Analytics.
In part one of this tutorial, we covered:
- Logging into the WordPress Dashboard
- Examining Pageviews/Traffic
- Digging deeper into Site Stats “Summaries”
Here in part two, we learned how to:
- Examine Top Posts & Pages
- Deep Dive into Individual Posts/Pages
- Look at Referral Data
Hopefully you can refer back to this guide when looking at the data within your Site Stats!

